
LeasePlan has reported a 9.7% rise in net profit to €467 million (£413m) and declared it wants to lead the trend from car ownership to usership, to subscription, in both the new and used car markets.
Billed as 'any car, anytime, anywhere', to help it achieve its strategic vision it has also launched CarNext.com, which it is hoping will disrupt both the B2C and B2B digital marketplace by enabling customers to buy, lease and subscribe to used cars in Europe.
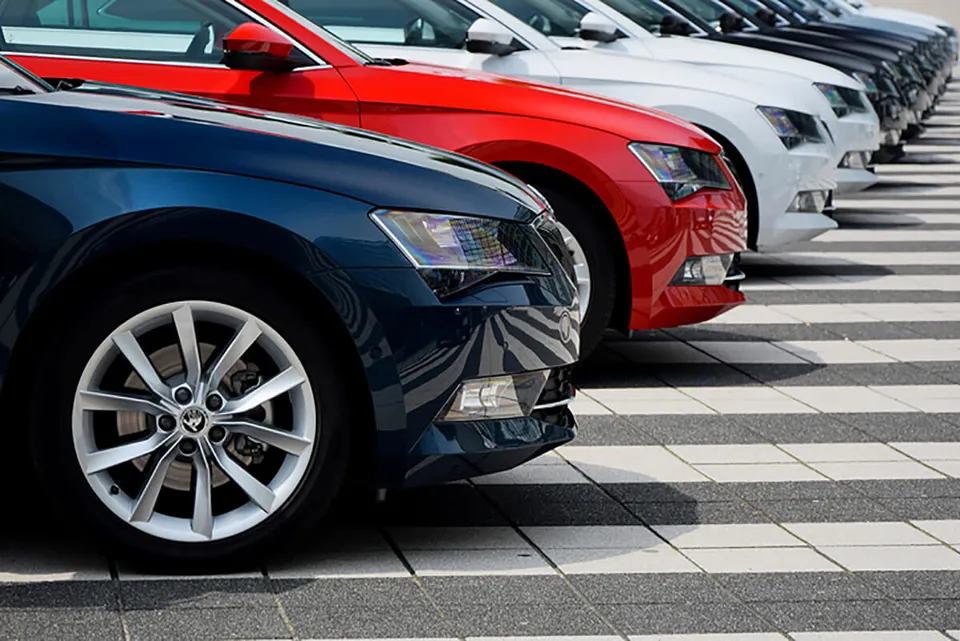
Fleet News revealed how LeasePlan was aiming to start remarketing its ex-lease cars directly to consumers through a new ‘clicks and bricks’ offering that mixes online services and physical experience centres, last year.
The move puts LeasePlan in a similar space to dealer or manufacturer-owned leasing companies like Arnold Clark Finance and Volkswagen Financial Services that have the ability to sell used fleet cars through their dealer networks.
LeasePlan’s CEO Tex Gunning, said: "I am delighted to announce yet another excellent set of results for LeasePlan in 2017.
“We have more cars on the road than ever before, and at the same time, our underlying net result and return on equity continued to increase significantly.”
Looking ahead, Gunning believes LeasePlan can achieve much more. “There is a clear megatrend from ownership to usership and subscription models taking place in both the new and high-quality used car markets,” he said.
“Increasingly, our customers - whether they are corporate, SMEs or private individuals - would prefer a 'Car-as-a-Service' with no strings attached in terms of car type or duration. They just want 'any car, anytime, anywhere'.”
LeasePlan, he says, will lead this trend. “With 1.7 million cars on the road in 32 countries, we are already a global leader in providing our customers with Car-as-a-Service for new cars - a business we will continue to invest in,” continued Gunning. “We are also in a unique position to lead the growing €65 billion Car-as-a-Service market for high-quality 3-4-year-old cars thanks to the introduction of our new CarNext.com business.”
He concluded: “The objective of LeasePlan Digital is simple: to deliver best-in-class digital services to all our customers in all areas of our business at digital cost levels, leveraging the latest digital technologies.
“Ultimately, this is how we provide our customers with 'any car, anytime, anywhere'. This is what's next for LeasePlan."
The CarNext.com platform will be supported by a pan-European network of up to 50 delivery stores, where customers can view used cars, receive necessary consultation services and make a final decision.
The online platform is already growing strongly. In the financial year 2017, CarNext.com grew its penetration of B2C sales in Europe from 7% to a run-rate of 15% at year-end 2017. In addition, used Car-as-a-Service was introduced at scale resulting in 3,200 used cars being leased in 2017. With LeasePlan responsible for 1.2 million cars on the road in Europe and a guaranteed supply of 250,000 cars returned every year, there is considerbale scope for growth.
Long-term, it expects CarNext.com to be a multi-hundred million Euro profit opportunity for LeasePlan, as the trend towards Car-as-a-Service takes place not just in the new car market, but also in the high-quality 3-4-year-old used car market.
Group performance
|
Underlying Income statement |
|
|
|
|
|
In millions of euros, unless otherwise stated |
2017 |
Y-o-Y growth |
2016 |
Y-o-Y growth |
|
Serviced fleet (millions), as at 31 December |
1,745 |
5.5% |
1,654 |
7.9% |
|
Lease & Additional Services Income |
6.497.8 |
|
6.261.9 |
|
|
Vehicles sales & end-of-contract fees |
2,863.1 |
|
2,937.1 |
|
|
Revenues |
9,360.9 |
1.8% |
9,199.0 |
3.4% |
|
Lease & Additional Services cost |
5,100.8 |
|
4,940.6 |
|
|
Vehicles & disposal cost |
2,706.0 |
|
2,750.6 |
|
|
Underlying direct cost of revenues |
7,806.8 |
1.5% |
7,691.2 |
3.7% |
|
As a % of Revenues |
83.4% |
|
83.6% |
|
|
Lease Services |
565.5 |
|
543.2 |
|
|
Fleet Management & other Services |
286.7 |
|
286.8 |
|
|
Repair & Maintenance Services |
307.0 |
|
289.5 |
|
|
Damage & Insurance Services |
237.8 |
|
201.9 |
|
|
End of Contract fees |
115.8 |
|
117.4 |
|
|
Profit/loss on disposal of vehicles |
41.3 |
|
69.0 |
|
|
Underlying gross profit |
1,554.1 |
3.1% |
1,507.8 |
1.5% |
|
As a % of Revenues |
16.6% |
|
16.4% |
|
|
Staff expenses |
543.0 |
|
567.8 |
|
|
Other operating expenses |
289.1 |
|
291.3 |
|
|
Other depreciation and amortisation |
47.7 |
|
55.3 |
|
|
Underlying total operating expenses |
879.8 |
-3.8% |
914.4 |
1.1% |
|
As a % of Revenues |
9.4% |
|
9.9% |
|
|
Share of profit of associates and jointly controlled |
2.3 |
|
4.6 |
|
|
Underlying profit before tax |
676.6 |
13.1% |
598.0 |
1.9% |
|
As a % of Revenues |
7.2% |
|
6.5% |
|
|
Underlying Tax |
145.0 |
|
142.7 |
|
|
Underlying net result |
531.6 |
16.8% |
455.3 |
7.1% |
|
As a % of Revenues |
5.7% |
|
4.9% |
|
|
Underlying adjustments |
(65.0) |
|
(29.8) |
|
|
Reported net result |
466.6 |
9.7% |
425.5 |
-3.8% |
|
As a % of Revenues |
5.0% |
|
4.6% |
|
More articles on:
Gareth has more than 20 years’ experience as a journalist having started his career in local newspapers in the 1990s. Prior to joining Fleet News in 2008, he worked in the public sector as a media advisor and is currently news editor at Fleet News.


Login to comment
Comments
No comments have been made yet.