

Latest Government statistics have revealed that UK drivers spent more time stuck in traffic in 2019 than the year before.
In 2019, the average delay on the Strategic Road Network increased by 0.1 seconds per vehicle per mile (up 0.9% on 2018). The average delay on local 'A' roads increased by 0.8 seconds per vehicle per mile (1.8% increase on 2018), according to statistics from the Government’s latest statistical release.
The findings from the Department for Transport's Travel time measures for the Strategic Road Network and local ‘A’ roads, England: January to December 2019 show that on the Strategic Road Network (SRN) in 2019, the average delay is estimated to be 9.5 seconds per vehicle per mile compared to speed limits, a 0.9% increase on the previous year.
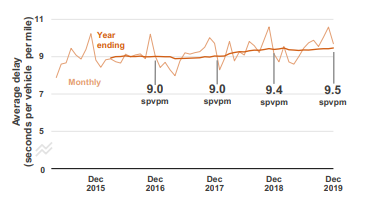
The statistical release also shows that the average speed of drivers was 58.8mph, down 0.5% from 2018.
The reliability of travel times is measured using the Planning Time Index which shows 67.3% of additional time is needed compared to speed limits on average, on individual roads sections to ensure on time arrival. This figure is up 1.1 percentage points in comparison to 2018.
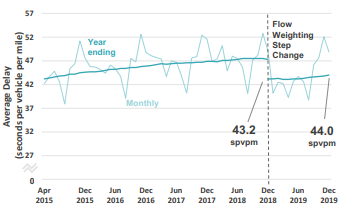
On local ‘A’ roads in 2019, the average delay is estimated to be 44.0 seconds per vehicle per mile compared to free flow, up 1.8% compared to 2018.
The average speed on local ‘A’ roads was 25.3 mph, no change compared to the previous year.
If you want to read the full document, you can find it here: https://assets.publishing.service.gov.uk/government/uploads/system/uploads/attachment_data/file/870292/travel-time-measures-srn-local-a-roads-2019.pdf
More articles on:
Jessica is event and digital content co-ordinator for all our events.
She was the web producer at Fleet News, Commercial Fleet and Smart Transport until April 2023.
She started her career as a content writer for a digital marketing agency that specialised in financial services, where she worked for more than two years.
Jessica was awarded the degree of Bachelor of Arts with Honours in Multimedia Journalism in 2017.


Login to comment
Comments
No comments have been made yet.