Northern Ireland, followed by the North-West and East Midlands has the lowest level of public charge point provision in the UK, new data from the Department for Transport (DfT) shows.
Northern Ireland has just 23 devices per 100,000 people, followed by the North-West and East Midlands with 39 and 43 devices per 100,000 respectively.
London, with the highest level of provision, has almost four times more than the North-West, with 152 charge points per 100,000 population.
Scotland, the next highest, has 73 devices per 100,000, while the average provision in the UK was 66 per 100,000.
In terms of those charge points with faster charging speeds (25kW and above), Scotland had the highest rate of provision, with 19.2 devices per 100,000, while the average provision in the UK was 12.6 per 100,000.
Rapid or quicker device provision was lowest for Northern Ireland with just rapid or quicker devices per 100,000.
The North-West and somewhat surprisingly London, given its overall public charge point provision, were the second and third lowest regions with 9.9 and 10.7 rapid or quicker devices per 100,000 respectively.
The DfT has published an interactive map of the data.
Public charge point growth
The new DfT charge point data, provided by Zapmap, also shows that total installed public charge points increased by 3,870 to 44,020 public electric vehicle (EV) charging devices in the last quarter, an increase of 10%.
Rapid charging or above devices increased by 814, an increase of 11%, bringing the total number to 8,461 – 19% of all charging devices.
Some 24,918 were rated “fast” chargers (7kW to 22kW), which represents 57% of all charging devices.
Meanwhile, 21,294 were designated as “destination” chargers, this represents 48% of all charging devices, and 14,848 were designated as “on street” chargers, this represents 34% of all charging devices.
Despite the DfT data showing the geographical disparity in the distribution of charging devices, all regions across the UK saw an increase in charge points from April to June.
The East of England had the greatest increase at 26.1%, while Scotland had the smallest increase at 1.7%.
The East of England also had the greatest increase in absolute number of devices at 652 devices, followed by London at 591.

The number of available devices can fluctuate for a range of reasons, says the DfT.
“Increases likely reflect the installation of new devices, whilst owners and operators can choose to temporarily or permanently decommission or replace devices,” it explained.
“Charging devices can also be unavailable due to faults, maintenance or other restrictions in the area where they are located, though data on the status of charging devices is not held by Department for Transport.”
Rapid charging or above devices have also increased in every region in the UK.
The smallest percentage increase in the number of rapid charging or above devices was London at 4.3%.
Northern Ireland had the largest percentage increase in rapid charging or above devices at 54.1%, corresponding to an increase of 20 rapid charging or above devices.
Since July 1, 2022, the number of installed public devices has increased by 12,009, a 38% increase.
The number of rapid charging or above devices increased by 42%, an additional 2,487 public devices installed.
Location of charging devices
The most common location category for charging devices is ‘destination’ with 21,294 charging devices or 48% of all publicly available charging devices.
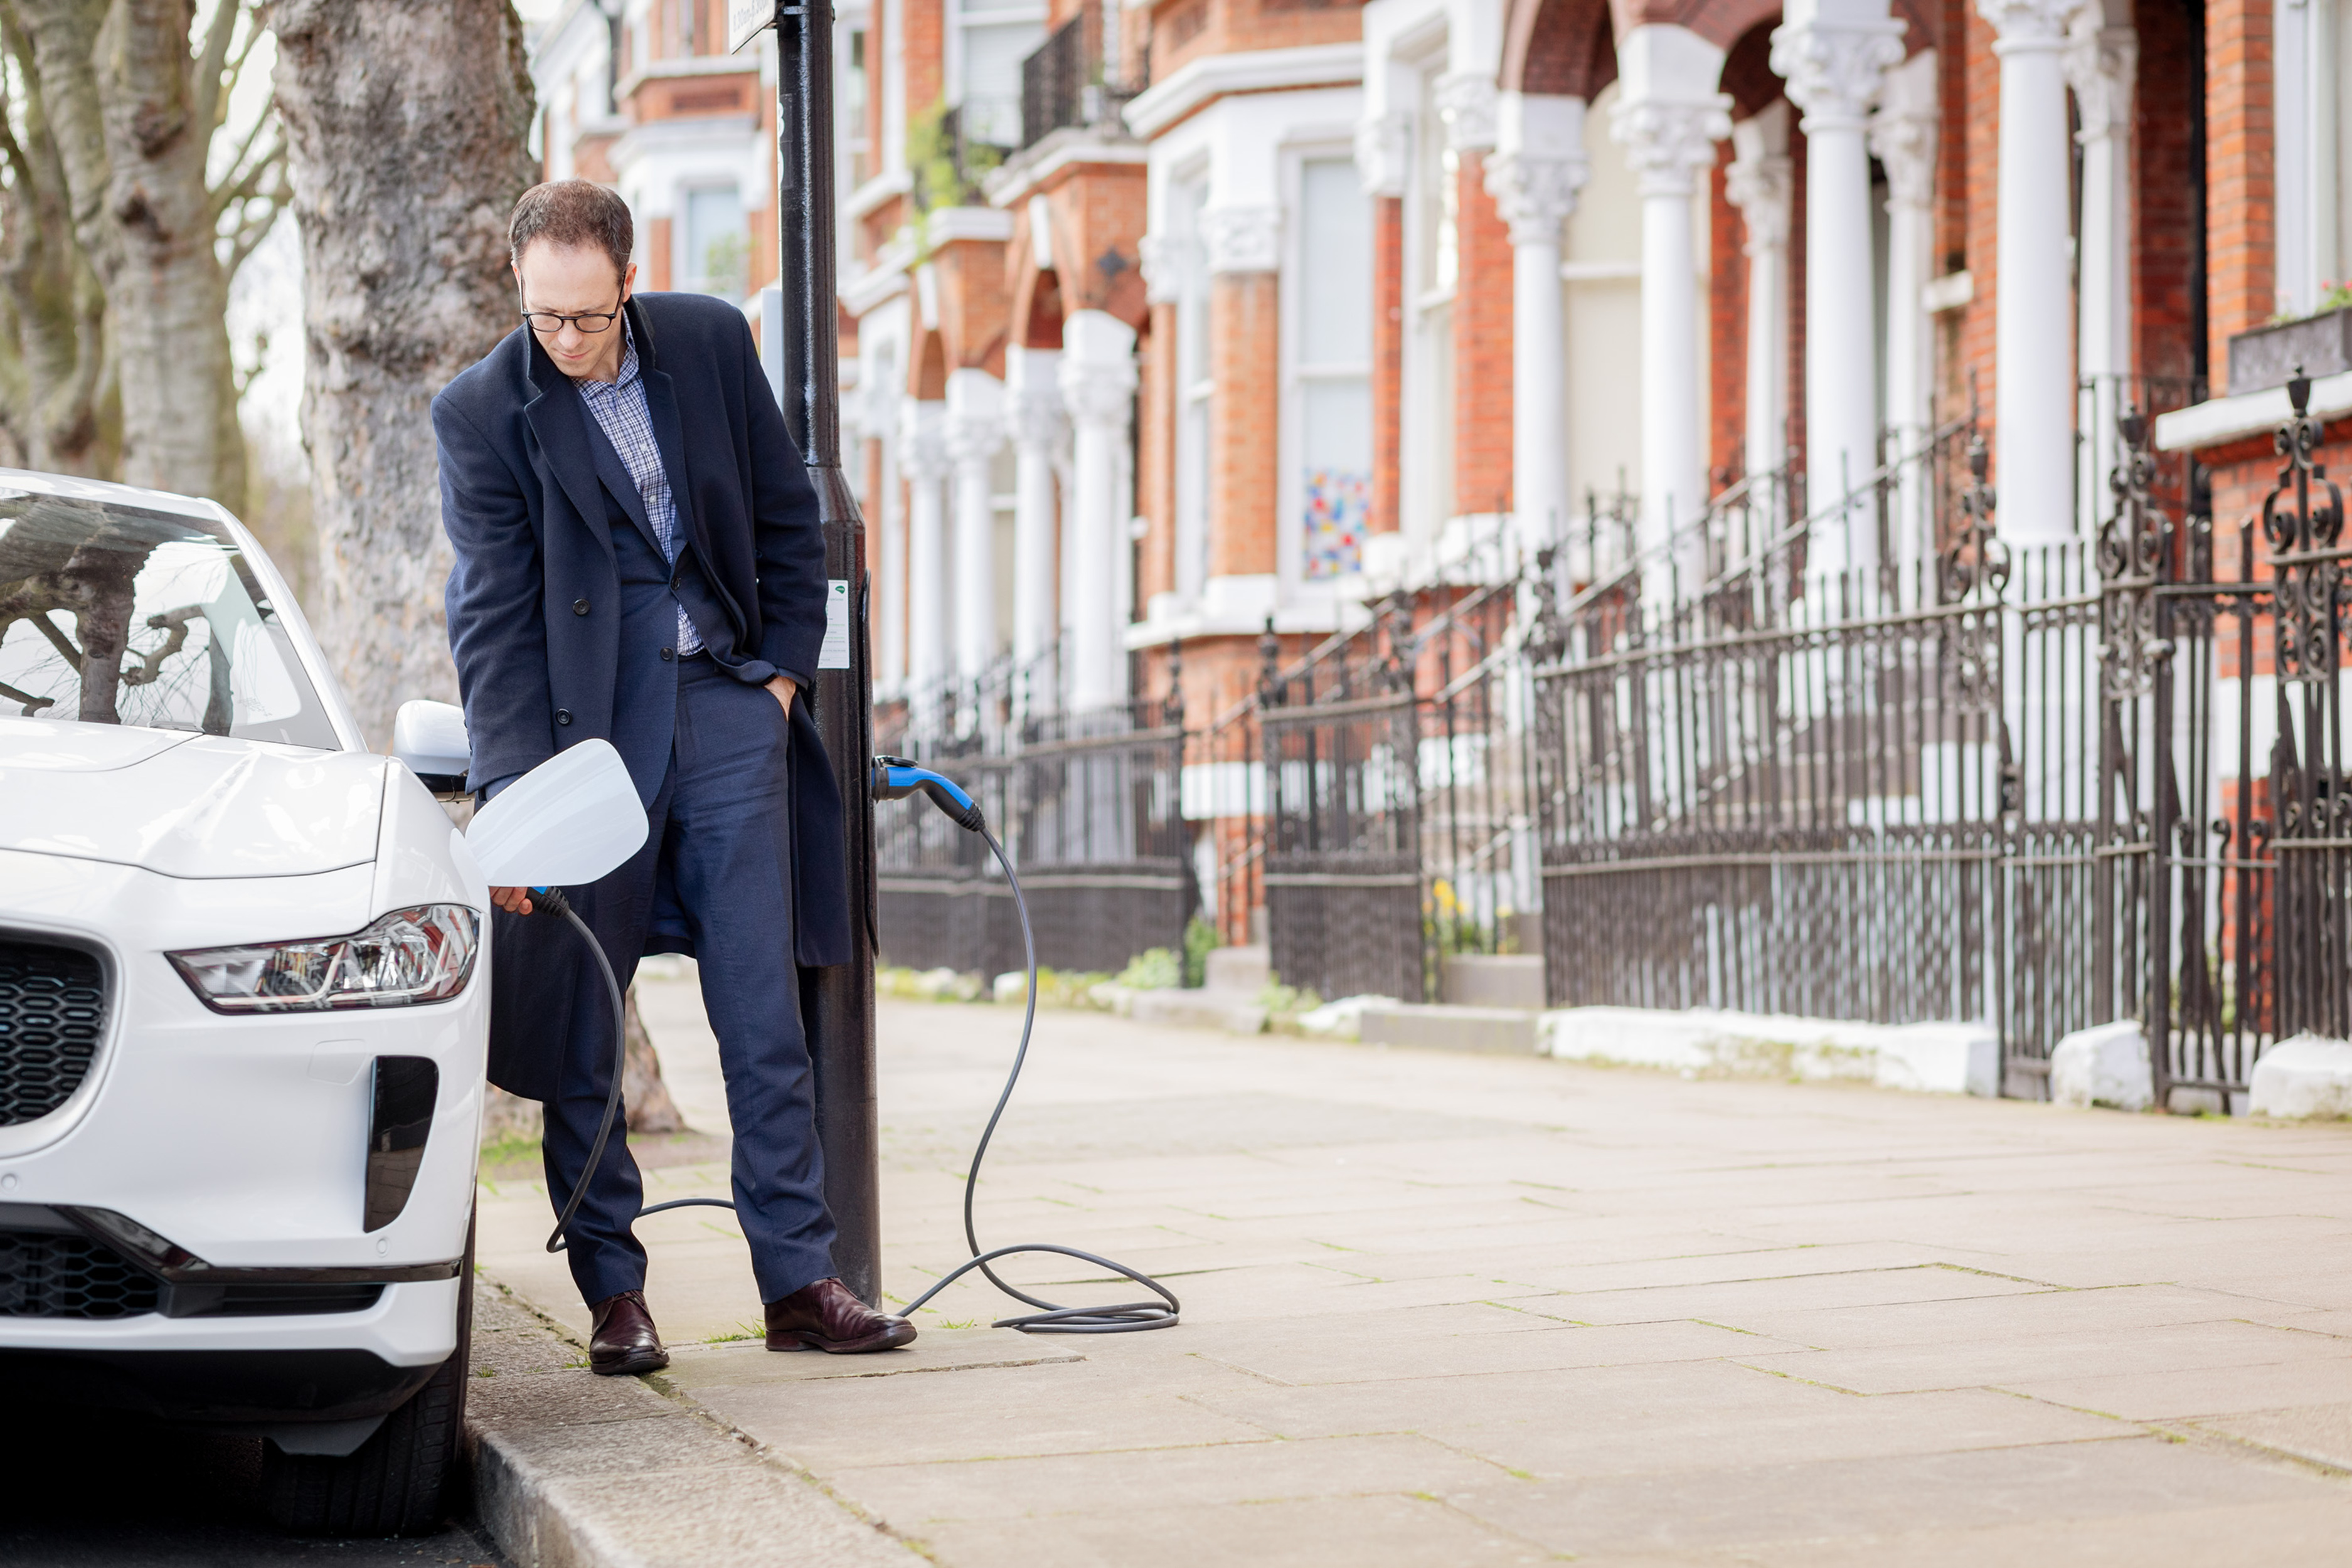
‘On-street’ charging devices account for 34% of charging devices or 14,848.
Trade body ChargeUK, which represents 23 companies that install and operate EV charge points in the UK, says that the latest DfT figures show the EV charging network is continuing to strengthen and grow across the country.
“The rate of deployment is already ramping up in all parts of the UK, but we can go faster still,” said a ChargeUK spokesperson.
"ChargeUK members are committed to making the UK the best place to own and charge an EV and key to that is having the right charging infrastructure in the right place.”
The next quarterly report is scheduled for release in October 2023.


Login to comment
Comments
No comments have been made yet.