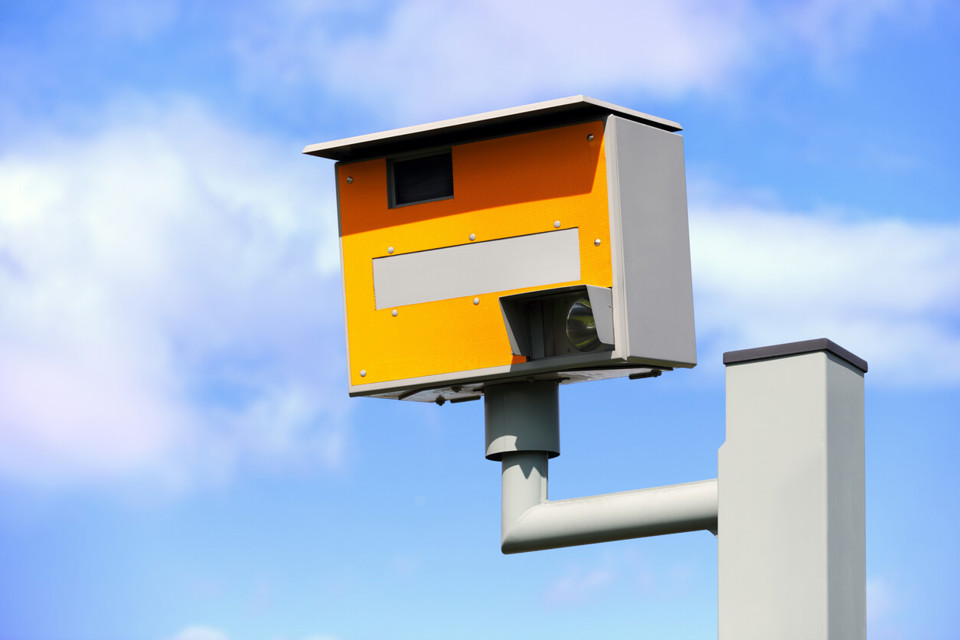
A disparity in the number of drivers detected for speeding offences suggests a postcode lottery, according to Home Office figures.
In 2017-18 – the latest period for which data is available – 1,191 road users were caught speeding in Wiltshire compared with 199,337 in Avon and Somerset, 167 times more.
Analysis of the figures by Dr Adam Snow for the RAC Foundation, shows that 2,292,536 speeding offences were detected across England and Wales in 2017-18, a 4% rise on the 2,213,257 figure for the previous year (2016-17).
Of these detections*:
- 44% resulted in the offender being sent on a speed awareness course.
- 34% attracted fixed penalty notices (FPN).
- 11% were later cancelled.
- 10% resulted in court action.
Steve Gooding, director of the RAC Foundation, said: “There will be many varied and obvious reasons to explain some of the differences between forces such as geographical area, road type and traffic volume. But a lot of it will come down to the local policing priorities.
“It is the job of Police and Crime Commissioners, and Chief Constables, to target resources appropriately, recognising the issues of greatest local concern.
“Changes and variations in the numbers of offences detected will reflect not just driver behaviour but also the extent of enforcement activity in any one year.
“Drivers tempted to flout the law should recognise that any targeted crackdown on speeding to curtail risky behaviour could swiftly be repeated if those reckless attitudes start to re-emerge.”
The police constabularies with the most speeding offences detected
|
Police force |
Speeding offences detected in 2017-18 |
% change on 2016-17 |
|
Avon and Somerset |
199,337 |
8% |
|
West Yorkshire |
174,796 |
42% |
|
Metropolitan Police (including City of London) |
139,318 |
58% |
|
Thames Valley |
131,401 |
-5% |
|
Greater Manchester |
101,421 |
-16% |
The police constabularies with the fewest speeding offences detected
|
Police force |
Speeding offences detected in 2017-18 |
% change on 2016-17 |
|
Wiltshire |
1,191 |
20% |
|
Durham |
8,802 |
18% |
|
Derbyshire |
10,480 |
3% |
|
Cleveland |
11,308 |
-16% |
|
Kent |
18,878 |
3% |
Detailed figures for all constabularies in England and Wales can be viewed here.
Figures for Gwent, Dyfed-Powys and South Wales should be treated with caution, because those offences detected by camera in Gwent and Dyfed Powys are included in the South Wales numbers and cannot easily be separated out.
Hence data for Gwent, Dyfed-Powys and South Wales has been excluded from the analysis done to produce the preceding tables.
* (Percentages for detections don’t add up to 100 because of rounding)


Alastair Haigh - 08/04/2019 11:43
It would be very interesting to see what the affect of all those speeding fines etc have on accidents and casualties. Perhaps this would help understand if the motive for catching speeders is road safety or collecting fines!