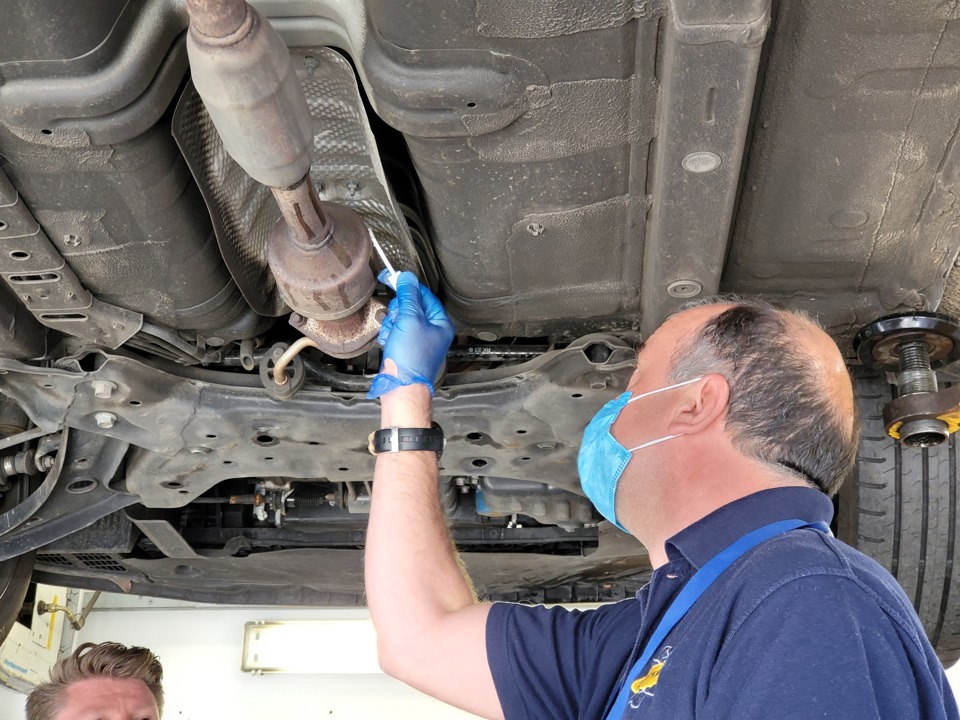
London, excluding the City of London, has been revealed as the place with the most catalytic converter thefts in the last three years, by GoShorty.
Since 2020, the research shows there have been 30,128 instances of catalytic converters being stolen in the capital, including those obtained by deception or recovered after a theft.
Hertfordshire placed second when it comes to thefts of catalytic converters. The Hertfordshire Constabulary recorded that 2,130 devices have been stolen since 2020.
In third place, the jurisdiction of Bedfordshire Police, including Bedford, Central Bedfordshire, and Luton, recorded a total of 919 catalytic converter thefts.
|
Rank |
Area |
Number of catalytic converter thefts (2020-2022) |
|
1 |
London (excluding the City of London) |
30,128 |
|
2 |
Hertfordshire |
2,130 |
|
3 |
Bedford, Central Bedfordshire, and Luton |
919 |
|
4 |
Leicestershire, Leicester and Rutland |
1,509 |
|
5 |
Dorset and Bournemouth, Christchurch and Poole |
960 |
|
6 |
Essex, Southend-on-Sea and Thurrock |
1,827 |
|
7 |
Warwickshire |
502 |
|
8 |
North Northamptonshire and West Northamptonshire |
606 |
|
9 |
Suffolk |
610 |
|
10 |
West Yorkshire |
1,067 |
The research also highlighted areas where thefts are increasing. Somerset, Bath, North East Somerset, Bristol, North Somerset, and South Gloucestershire saw a 456% increase in stolen catalytic converters.
In second place, catalytic converter thefts are rising in Carmarthenshire, Ceredigion, Pembrokeshire, and Powys: there was a 300% increase in thefts between the 2020 and 2021 calendar years.
West Yorkshire is one of the areas where catalytic converter theft is rising the fastest. According to police statistics, there was a 144% increase in catalytic converter thefts from 2020 to 2021.
|
Rank |
Area |
Increase in thefts (2020-2021) |
|
1 |
Somerset, Bath, North East Somerset, Bristol, North Somerset, and South Gloucestershire |
456% |
|
2 |
Carmarthenshire, Ceredigion, Pembrokeshire, and Powys |
300% |
|
3 |
West Yorkshire |
144% |
|
4 |
Dorset and Bournemouth, Christchurch and Poole |
102% |
|
5 |
Northern Ireland |
100% |
|
5 |
Gloucestershire |
100% |
|
7 |
Derbyshire and Derby |
96.00% |
|
8 |
Tyne and Wear and Northumberland |
86.00% |
|
9 |
East Sussex, West Sussex and Brighton and Hove |
65.00% |
|
10 |
Surrey |
52.00% |


Login to comment
Comments
No comments have been made yet.