A record-breaking number of speeding fines have been issued, while drivers caught using a mobile phone behind the wheel have also increased significantly, according to new figures from the Home Office.
More than 2.5 million drivers faced a fixed penalty, a driver awareness course or sent to court in 2022.
Meanwhile, with tougher laws on mobile phone use while driving introduced in March 2022, drivers falling foul of the legislation rose by 93% year-on-year.
Jack Cousens, head of roads policy for the AA, said: “Almost 3 million drivers were caught and prosecuted for how they acted on the roads.
“With speeding at a record high, it is a timely reminder that the best regulator of speed is the driver’s right foot.”
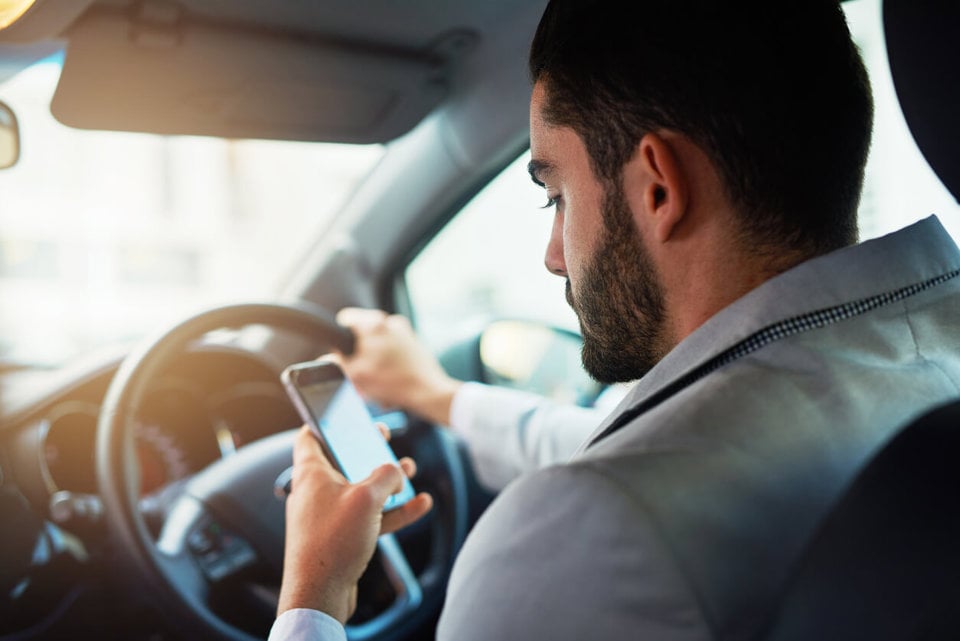
He added: “The tightening of the law for using a handheld mobile phone behind the wheel saw a significant increase in drivers being issued fines and points.
“The AA led the campaign to highlight the dangers of picking up the phone while driving, now we need drivers to hang up their handset rather than fiddle with the phone.”
The Home Office data also highlights how, with changes in the Highway Code in January 2022, which introduced a hierarchy of road users and better protections for pedestrians, saw offences for neglecting pedestrian rights and traffic signs increase by a third compared to 2021.
That comes after recent research from the RAC showed that a third (31%) of drivers think pedestrians face even greater danger at junctions after the changes to the Highway Code were meant to improve safety.
Operation Snap helping forces
While the vast majority of fines are issued by police officers catching people in the act and official enforcement cameras, the rise of dashcams in cars as well as cameras used by cyclists and horse riders are helping capture bad driving through Operation Snap.
Police forces across the UK are now receiving more video footage and evidence of dangerous and poor road behaviours, meaning that the chances of being caught has grown significantly through citizen owned cameras.
Cousens said: “With the rise of dashcams and riders wearing cameras, drivers behaving badly should beware that someone is always watching.
“Police forces are utilising the footage to hold drivers to account and using the film as evidence to prosecute offenders.
“Police owned and private cameras are a useful tool in catching bad driving in the act, but we do not want to see an overreliance on technology.
“The best way to deter illegal driving behaviours is to increase the number of traffic officers and visible presence on our roads.”
AA Analysis of Home Office Motoring Fixed Penalty Notices
| Offence Description | 2011 | 2012 | 2013 | 2014 | 2015 | 2016 | 2017 | 2018 | 2019 | 2020 | 2021 | 2022 | Number (thousands) |
% |
| Careless driving offences (excl. use of handheld mobile phone while driving) | 5.8 | 6.3 | 8.5 | 15.0 | 16.4 | 16.8 | 15.3 | 18.5 | 24.6 | 30.2 | 41.9 | 42.7 | 0.8 | 1.8 |
| Use of handheld mobile phone while driving | 162.4 | 133.7 | 113.7 | 97.4 | 86.4 | 79.9 | 53.0 | 38.5 | 28.3 | 17.9 | 19.6 | 37.9 | 18.2 | 93.0 |
| Licence, insurance and record-keeping offences | 94.6 | 92.6 | 87.5 | 76.2 | 72.2 | 85.9 | 91.3 | 95.9 | 102.2 | 114.5 | 111.1 | 102.0 | -9.1 | -8.1 |
| Work record or employment offences | 6.5 | 7.6 | 6.3 | 4.8 | 5.6 | 5.2 | 5.5 | 5.7 | 5.0 | 3.2 | 3.3 | 3.7 | 0.4 | 11.3 |
| Operator's licence offences
|
0.1
|
0.1
|
0.1
|
0.0
|
0.0
|
0.0
|
0.0
|
0.0
|
0.0
|
0.0
|
0.1
|
0.0
|
-0.0
|
-15.4
|
| Vehicle test and condition offences
|
82.0
|
84.1
|
87.1
|
68.9
|
60.8
|
58.3
|
50.9
|
49.1
|
51.9
|
41.0
|
55.3
|
51.8
|
-3.5
|
-6.4
|
| Speed limit offences
|
1,494.2
|
1,590.4
|
1,659.8
|
1,863.3
|
1,945.0
|
1,970.2
|
2,013.8
|
2,101.6
|
2,253.9
|
2,006.4
|
2,371.8
|
2,522.6
|
150.7
|
6.4
|
| Neglect of traffic signs and directions and of pedestrian rights
|
146.5
|
127.9
|
116.1
|
98.3
|
125.9
|
100.4
|
95.7
|
102.0
|
92.8
|
68.5
|
78.9
|
105.5
|
26.6
|
33.8
|
| Obstruction, waiting and parking offences
|
125.8
|
98.0
|
56.9
|
47.4
|
44.5
|
38.7
|
32.9
|
31.7
|
32.1
|
24.2
|
18.3
|
15.8
|
-2.5
|
-13.4
|
| Lighting and noise offences
|
15.2
|
14.5
|
17.4
|
11.2
|
8.2
|
8.4
|
6.5
|
6.7
|
7.2
|
7.8
|
8.0
|
8.0
|
0.0
|
0.1
|
| Other offences
|
10.9
|
11.8
|
10.8
|
9.2
|
7.0
|
7.2
|
7.1
|
7.1
|
7.4
|
9.9
|
13.0
|
13.7
|
0.7
|
5.4
|
| Miscellaneous motoring offences (excluding seat belt offences)
|
1.1
|
0.9
|
0.6
|
1.4
|
1.8
|
0.7
|
0.3
|
0.3
|
0.4
|
0.4
|
0.6
|
0.6
|
0.0
|
7.9
|
| Seat belt offences
|
137.0
|
133.2
|
86.3
|
45.3
|
29.6
|
19.6
|
18.5
|
21.6
|
39.7
|
48.2
|
50.4
|
48.4
|
-2.0
|
-3.9
|
|
|
2,282.1
|
2,301.0
|
2,251.1
|
2,338.3
|
2,403.5
|
2,391.4
|
2,390.9
|
2,478.8
|
2,645.8
|
2,372.1
|
2,772.2
|
2,952.7
|
180.5
|
6.5 |










Login to comment
Comments
No comments have been made yet.