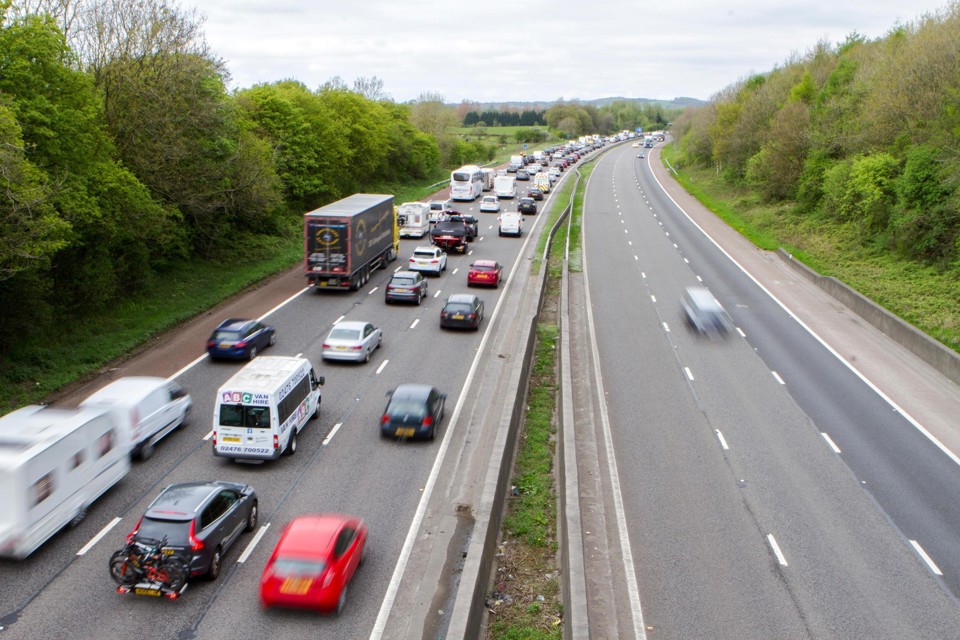
Almost three-quarters (72%) of business trips were made by car or van in 2019, according to new data in the National Travel Survey.
The survey results, published by the Department for Transport (DfT), also show less than one in 10 (7%) business trips were made by rail.
The average number of business trips per person was 28, while their average business mileage was 555 miles and average journey time was 42 minutes.
The National Travel Survey is a household survey of personal travel by residents of England travelling within Great Britain, from data collected via interviews and a seven-day travel diary, which enables analysis of patterns and trends.
The business travel statistics highlighted in the report, therefore, need to be treated with a degree of caution, having been drawn from such a small sample.
The National Travel Survey, however, does give an interesting overall look at travel habits of the wider population.
On average, people spent just over an hour a day travelling in 2019, including 35 minutes by car (as a driver or passenger), 11 minutes walking, 13 minutes on public transport and 2 minutes on other private transport modes. The most common trip purpose in 2019 was for leisure (26%), followed by shopping trips (19%) and commuting (15%). These proportions are broadly unchanged since 2002, but the total amount of trips and total distance travelled has decreased since 2002, and 2018.
The report suggests that factors behind the decrease might include, changing demographic patterns, changing patterns of trips, and the impact of new technologies influencing the demand for travel; for example the increase in online social networking, the capability for home working and online shopping.
The trip rate in 2019 was 11% lower than 2002 figure of 1,074; the average of 6,500 miles travelled in 2019 was also 10% lower than the 7,193 recorded in 2002.
CAR OWNERSHIP AND LICENSING STATISTICS
In 2019, 75% of English residents aged 17 and over held a driving licence. Around 80% of men in this group hold a licence, a figure that is broadly unchanged since 2002.
Around 71% of women in this group hold a driving licence, however this figure has grown by 15% since 2002.
Between 2002 and 2019, the number of licence holders increased by more than two and half times, to 32.7 million individuals.
With regards to the proportion of men and women who live in households without access to a car, the proportion of men in these households in 2019 was 17%, an increase of half a percentage point since 2002.
When considering women, 20% live in households without access to a car, a decrease of 2.8 percentage points over the same period.
Looking at households in England, 76% own at least one car, an increase of 2 percentage points since 2002. This figure depends heavily on household income, says the report. More than half (55%) of households in the bottom 20% of household income during 2019 own at least one car (up 5 percentage points since 2002), compared to 86% of households in the top 20% of household income during 2019 (up 2 percentage points since 2002).
Read the full National Travel Survey report here.











Login to comment
Comments
No comments have been made yet.