

There has been a 29% reduction in the number of roads resurfaced in the past five years, new analysis of Government data shows.
In 2021/2022, figures show just 1,123 miles of all types of road were resurfaced compared to 1,588 in 2017/2018 – this equates to a 29% reduction (465 miles), according to research conducted by the RAC.
For surface dressing – a technique that extends the life of roads and helps to prevent the need for full resurfacing – the figures were 3,551 miles in the last financial year compared to 5,345 five years ago, a 34% drop, or 1,794 miles.
Of the 153 roads authorities included in the latest data (2021/2022), three-in-10 (31%) did no resurfacing while half (51%) failed to carry out any surface dressing work.
The average length of road resurfaced for all authorities over the 12 months was just 13 miles while it was 42 miles for surface dressing.
Kent resurfaced the most miles of A road at 29 of its 502 miles (5.8%), while Lincolnshire did the most surface dressing at 50 miles of its 661 miles of A road (7.6%).
Looking at B, C and unclassified roads, Hertfordshire led the way in resurfacing by replacing 41 miles (1.5%) of its 2,759 network roads and Norfolk topped the table in surface dressing by treating 326 miles of its 5,627 roads (5.8%).
In percentage terms however, Southend-on-Sea resurfaced the greatest proportion of its 21-mile A-road network at 13% (3 miles) while Blackpool surfaced dressed 43% (11 miles) of its 26 miles of A-road.
For B, C and unclassified roads Tower Hamlets did the largest proportion of resurfacing at 14% (21 miles of its 152-mile network) and Reading surfaced dressed 15% (34 miles) of its 224-mile network.
The figures come as the RAC renews its call for the Government to change the way it funds local roads maintenance, ideally by ringfencing a proportion of money raised through fuel duty to give councils the certainty of having longer-term funding that ultimately enables them to get all the roads in their control into a better overall condition.
RAC head of policy Simon Williams said: “These figures paint an incredibly stark picture of road maintenance in England and confirm our worst fears about the overall decline in the state of the country’s roads.
“While the Government has made more money available to authorities to fill potholes, it’s the general reduction in road improvement work that’s causing potholes to appear in the first place.”
Williams says that it’s “abundantly clear” that councils in so many areas are “barely scratching the surface” when it comes to getting their roads up to a reasonable standard.
“Indeed, the fact that such a large proportion haven’t done any surface dressing or resurfacing at all over a 12-month period really does say it all,” he added.
“Resurfacing is expensive but for some roads this will be the only course of action as they have fallen into such bad condition that nothing else can save them.
“Having said that, we urge authorities to make greater use of surface dressing and other preventative treatments which can be used successfully to improve surfaces and extend the lives of roads.”
Scale of the problem
The scale of the problem facing authorities in England is bleak according to the Asphalt Industry Alliance (AIA)’s Annual Local Authority Road Maintenance (ALARM) report, published in March 2023.
It estimates the total amount of money now needed to address the backlog in road maintenance works has increased to more than £12 billion and would take 11 years to clear.
The RAC, however, believes these figures are somewhat skewed towards full resurfacing and that more could be done to improve conditions for drivers by using more cost-effective road surface treatments.
For example, according to the Road Surface Treatments Association (RSTA) it costs £5 per square metre to surface dress a heavily trafficked A or B road compared to £30 per square metre for conventional asphalt resurfacing.
Another treatment is asphalt preservation which is designed to be used on roads that are already in very good condition.

A highly cost-effective solution for sealing and maintaining roads to prevent water ingress, it is widely used by the privately financed operators in charge of major roads such as the M40, A50 and M6 Toll as it is cost-efficient, has a very low carbon footprint and can be laid at night to avoid disruption.
RSTA chief executive Paul Boss said: “Proactive surface treatment maintenance programmes, backed up by a risk-based approach to resurfacing the worst roads, have been proven to keep roads in better condition for longer, and that’s why private road operators use them.
“Vitally, they help to prevent damage caused by the freeze-thaw cycle where water gets into defects in surfaces, freezes and expands, causing cracks and potholes.
“Surface dressing, which is the most well-known treatment, maximises life expectancy by making roads last three to four times longer than without the preventative treatment, and with very little carbon generation.”
He added: “There has never been a more important time to undertake preventative maintenance on roads in what we call ‘Green’ and ‘Amber’ conditions, even where pothole repairs may well be required before the surface dressing can be undertaken.
“The preventative dressing on ‘Green’ and ‘Amber’ carriageways will keep them in a safe and serviceable condition, enabling authorities to manage their ‘Red’ roads that require high investment maintenance solutions such as complete resurfacing or reconstruction (recycling).
“These ‘Red’ roads can then be picked off for full resurfacing one by one with any finance left over. If not, at least they can be managed and kept safe without the additional burden of untreated ‘Green’ roads becoming ‘Amber’ and ‘Amber’ roads becoming ‘Red’.”
The RAC understands surface treatments also offer time-savings as they can be carried out in a day or even a few hours, meaning specialist traffic management is normally only required for a short period of time.
In contrast, asphalt resurfacing requires long periods of active traffic management which sometimes has to be put up and removed each day to fit in with restricted working hours, adding further to the duration of the works.
The advantages of preventative surface treatments are laid out in a new RAC report published today (Wednesday, September 13).
Williams said: “Drivers contribute billions of pounds to the Treasury every year, so it’s extremely frustrating that they continue to have to endure substandard road surfaces.
“We encourage local authorities to take a more preventative approach to road maintenance as this will make their squeezed budgets go further and improve England’s roads for the future.
“We also continue to call on the Government to increase the roads funding settlements for councils, not least because England’s major roads receive seven times what local roads are given, despite the fact there are seven times more miles of minor roads.”
Damage caused by poor roads
The RAC’s findings come as new analysis from Halfords suggests that almost half of drivers (45%) say that their vehicle has been damaged due to poorly maintained roads in the past year, costing drivers an average of £922 to fix.
Unsurprisingly, potholes are the main culprit, causing damage to more than a quarter (27%) of UK drivers’ vehicles in the past 12 months, and leading to an average of £718-worth of damage.
Furthermore, nearly a quarter (23%) of drivers say they have had an ‘accident or a near miss’ as a result of a pothole.

Aside from potholes, damage was most commonly caused by road debris such as loose tarmac, or uneven or damaged road surfaces.
If a motorist’s car is damaged as a result of poorly maintained roads, they are entitled to claim compensation from those responsible for maintaining the roads – most commonly the local council. Yet, in the past year, a new Freedom of Information request, conducted by Halfords, reveals that UK councils have paid out just £907,552 to motorists (see below).
One council – West Northamptonshire – received 849 claims from motorists for pothole damage in the past 12 months, but paid out just one claim, totalling £148. This is a success rate of 0.1% of claims.
Worcestershire County Council, meanwhile, boasted of its ‘good defence rate for highway claims’ and confirmed it paid out ‘between one and five claims’, totalling £1,370.
Some councils pay out far more. Top of the league table is Wiltshire County Council, which paid out 42% of the claims it received, totalling £95,292. But nationally, just 13% of claims made received any pay out whatsoever from the local council.
Tyres are the most commonly-damaged item as a result of poorly-maintained roads (46%). However, 25% received damage to their wheels/alloys, such as cracking or bending, 21% experienced damage to their windscreen, and 20% to their brakes.
Meanwhile 18% say the underside of their car was damaged and 9% even had the frame/chassis of their car damaged.
Halfords CEO, Graham Stapleton, said: “The figures are very worrying and highlight the true cost of the lack of investment in UK roads.”
However, he added: “It’s not just about cost, it’s about safety, with nearly a quarter of motorists saying a pothole in the road has led to an accident or a near miss.
“Few things are more frightening than being presented with a huge pothole when travelling on a motorway at full speed – forcing drivers to make a split-second decision as to whether they can avoid it, or simply have to plough through it and hope for the best. And as the freedom of information request shows – even if they do make a claim, the chances of getting any compensation are minimal.
“I urge the Government to increase this funding if they are truly on the side of the motorist.”
Ring-fence funding for road maintenance
The All-Party Parliamentary Group for Better Roads has issued a report calling for central government to re-instate effective ring-fencing and multi-year settlements for local road maintenance.
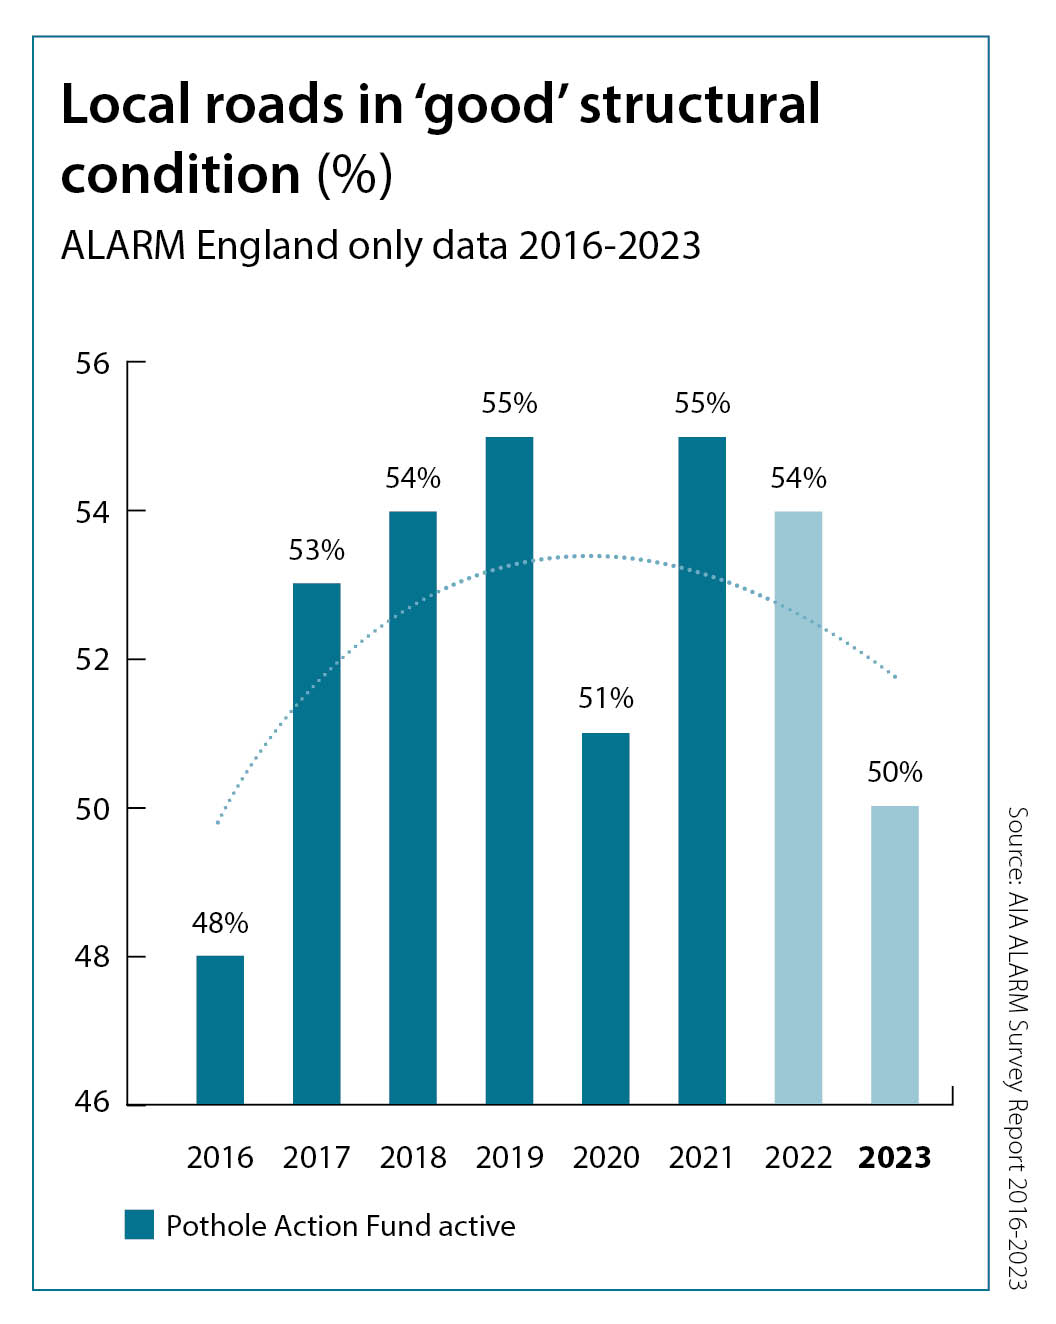
The report draws on a review of the Pothole Action Fund (2015/16-2020/21) demonstrating that it was a successful policy which contributed to marked improvements in the overall structural conditions on the local road network – but since its replacement gains made have been lost.

The Pothole Action Fund formed part of a six-year commitment specifically allocated to English local authorities.
Highway teams were able to use the secure funding for preventative maintenance and resurfacing works as well as pothole repairs.
Analysis for the APPG for Better Roads indicates that this ring-fencing led to a marked improvement in the proportion of the local network classed as being in a ‘good condition’ with 12,377 miles, or 7% of the English local road network, moving into this category during the life of the fund.
In contrast, since 2021 when the Pothole Action Fund was incorporated into councils’ general block highway funding from the Department for Transport (DfT), the number of roads classed as 'good' has gone into reverse.
The APPG report points to data that shows there are now 5% fewer – 8,811 miles of English local roads – in this category than 2020/21, the last year of the fund.
The APPG for Better Roads’ report is informed by the Asphalt Industry Alliance’s Annual Local Authority Road Maintenance (ALARM) survey reports.
Reviewing ALARM data, the APPG report also highlights that shortfalls in local authority annual highways maintenance funding have been rising steeply – up 82% – since the Pothole Action Fund ceased to be ring-fenced.
Sir Christopher Chope MP, chairman of the APPG for Better Roads, said: “Both the Prime Minister and the Chancellor have pledged to tackle the ‘plague of potholes’ on our local roads. But, as this report shows, funding for local road maintenance is falling and the Government’s assumption that hard pressed local authorities will spend allocations on roads is not enough.
“The roll out of autonomous vehicles and decarbonising transport will place even greater funding pressure on our local road network in the years ahead. That’s why we are calling for a Better Roads Fund to be created with longer term funding commitments, budget ring-fencing and full transparency on allocation.
“This Better Roads Fund would help deliver a sustained improvement in road conditions and enhanced network resilience. It would also save money over the long term and ensure our local roads are able to support the challenges ahead.”
The full report ‘Working for better roads: A call for the re-instatement of effective ring-fencing for local road maintenance’ is available to download from the APPG for Better Roads website.
Full Freedom of Information request results (councils which responded)
|
Council District/County Council |
Requests for claims |
Claims Paid |
Average paid out per claim |
Total paid out |
Paid out (%) |
|
West Northamptonshire Council |
849 |
1 |
£148.48 |
£148.48 |
0.12% |
|
Worcestershire County Council |
134 |
‘1-5’ |
/ |
£1,370.22* |
1.87%* |
|
Durham County Council |
116 |
2 |
£164.39 |
£328.78 |
1.72% |
|
East Riding of Yorkshire Council |
126 |
3 |
£632.00 |
£1,896.00 |
2.38% |
|
Dorset Council |
239 |
4 |
£246.38 |
£985.52 |
1.67% |
|
Gloucestershire County Council |
602 |
10 |
£214.70 |
£2,147.00 |
1.66% |
|
Herefordshire Council |
223 |
17 |
£556.65 |
£9,463.05 |
7.62% |
|
Nottinghamshire County Council |
1,228 |
25 |
£399 |
£9,975.00 |
2.04% |
|
Central Bedfordshire |
748 |
27 |
£222.22 |
£5,999.94 |
3.61% |
|
Cornwall Council |
315 |
35 |
£237.86 |
£8,325.10 |
11.11% |
|
SuffolkCounty Council |
348 |
71 |
£222.35 |
£15,786.85 |
20.40% |
|
Kent County Council |
1645 |
86 |
£192 |
£16,512.00 |
5.23% |
|
NorfolkCounty Council |
471 |
98 |
£334.00 |
£32,732.00 |
20.81% |
|
West Sussex County Council |
1045 |
108 |
£299.88 |
£32,387.04 |
10.33% |
|
Warwickshire County Council |
422 |
114 |
£388.00 |
£44,232.00 |
27.01% |
|
Westmorland and Furness Council |
492 |
133 |
£310.72 |
£41,325.76 |
27.03% |
|
Derbyshire County Council |
471 |
150 |
£237.92 |
£35,688.00 |
31.85% |
|
Hampshire County Council |
1,212 |
152 |
£257.11 |
£39,080.72 |
12.54% |
|
Hertfordshire County Council |
1852 |
181 |
£352.81 |
£63,858.61 |
9.77% |
|
East Sussex County Council |
1805 |
196 |
£385.00 |
£75,460.00 |
10.86% |
|
Lincolnshire County Council |
1558 |
223 |
£207.12 |
£46,187.76 |
14.31% |
|
Devon County Council |
1,311 |
239 |
£192.00 |
£45,888.00 |
18.23% |
|
Cambridgeshire County Council |
1789 |
244 |
£271 |
£66,124.00 |
13.64% |
|
Surrey County Council |
3,354 |
257 |
£389.61 |
£100,129.77 |
7.66% |
|
Staffordshire County Council |
1867 |
258 |
£226.25 |
£58,372.50 |
13.82% |
|
Oxfordshire County Council |
1416 |
285 |
£203 |
£57,855.00 |
20.13% |
|
Wiltshire Council |
973 |
408 |
£233.56 |
£95,292.48 |
41.93% |
Source: Halfords
More articles on:
Date: October 7 - 8 2025
Venue: NEC Birmingham
The UK's leading annual event for the fleet and mobility community.
Acquire invaluable best practice insights, establish meaningful connections, and stay informed about the latest developments in legislation, sustainability, EV approaches, employee benefits, and more.
REGISTER YOUR INTEREST
Gareth has more than 20 years’ experience as a journalist having started his career in local newspapers in the 1990s. Prior to joining Fleet News in 2008, he worked in the public sector as a media advisor and is currently news editor at Fleet News.


Login to comment
Comments
No comments have been made yet.