New testing regimes aim to give CO2 and economy figures that more accurately reflect true driving experiences. Christopher Smith reports

It’s no secret that the emissions of cars and vans in the ‘real world’ are often massively out of kilter with the official test figures.
Volkswagen Group’s nitrogen oxide (NOx) emissions scandal brought it to the forefront of public attention, and since then there has been relentless coverage in the media about the disparities in these figures.
The most common comparator of emissions is carbon dioxide (CO2), which directly relates to the fuel economy of a vehicle, the primary measurement on which a driver or fleet manager will compare their vehicles to the official figures.
A Fleet News poll last year found more than half (51.5%) of respondents saw an average shortfall of more than 20% on their vehicle’s official figures – with only 5.1% achieving within 5% of the official data.
The industry – and governments – have known for a long time that the NEDC (New European Test Cycle) system is not representative of real-world performance. It was designed in the 1980s and last updated in 1997.
The European Union is leading the introduction of a new, replacement system, the Worldwide harmonised Light vehicles Test Programme (WLTP), for use globally.
The test, still performed in a laboratory, is a third longer, and has been designed to more closely reflect everyday driving. It covers 23km (14 miles), up from the NEDC’s 11km (seven miles), and stationary time is reduced from 25% to 11%.
Average and top speeds are marginally higher, too. It’s a global standard, so figures will now be comparable outside of Europe more easily.
All new vehicle type approvals will have to be measured under this test from September this year, with all vehicles on sale falling under the scheme by September 2018.
Manufacturers are already taking this into account. Under the NEDC cycle test, the new Vauxhall Insignia Grand Sport produces 105g/km – higher than direct rivals. However, James Taylor, the brand’s fleet sales director, says the car has been set up for the WLTP tests.
“My feeling is that the Insignia will look very good when all cars are on this testing in 2018,” he adds.
Vauxhall is not the only manufacturer releasing more realistic testing figures; PSA Group has gone even further than WLTP by opting to test all its models and engines using portable emissions technology.
WLTP is not perfect. Nick Molden, founder and CEO of Emissions Analytics, believes that under the new methodologies, the current mpg gap of 29% and the CO2 gap between official and ‘real-world’ of around 40% will approximately halve.
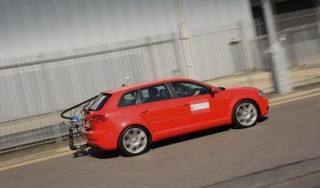
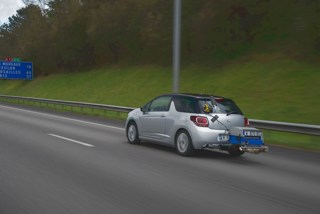
Emissions Analytics tests cars using the same portable emissions technology that PSA Group is using, on British public roads (see Equa Index panel above).
It crunches the data to remove any statistical variances caused by traffic flow, to provide an accurate representation of real-life performance.
The Jaguar XE saw the biggest difference, of 39.2%. A spokesman declined to comment on “non-official tests where the robustness or methodology is unclear”, adding that Jaguar Land Rover diesel vehicles “will be fully compliant with all worldwide emissions regulations”.
Meanwhile, Ford pointed out that there would always be variances between official and on-road figures due to “different conditions – temperature, humidity, aerodynamic resistance, road surface – all of which can increase emissions”.
There are still significant questions that remain unanswered surrounding the introduction of WLTP.
HM Treasury confirmed to Fleet News in February that figures registered on the new test would not be used for benefit-in-kind (BIK) and vehicle excise duty (VED) calculations immediately, removing the risk of a two-tier tax system.
The Treasury has not yet announced when it will move bands to the new data, however.
After the Volkswagen emissions scandal, air quality and the effects of NOx emissions have become the hot topic for governments and local authorities.
Unlike fuel economy, this is harder for a fleet to measure or acknowledge that its vehicles are not meeting the required standards – until now, claims Emissions Analytics.
In addition to reporting more accurate fuel economy and CO2 data, the company has also been monitoring real-world NOx emissions. Its testing found some vehicles were emitting more than 12 times the official legal limit.
There’s now a plan to tackle that – yet another vehicle test, the Real Driving Emissions (RDE) programme.
Also rolled out from this September alongside the WLTP test, RDE takes place on road.
“One of the weaknesses of RDE is that the manufacturers will conduct their own tests on their own routes, albeit witnessed by a type approval authority,” says Molden.
It’s a two-step phased roll-out, introduced after the Volkswagen emissions scandal. Manufacturers are pushing the EU to delay the introduction, but this seems unlikely.
While manufacturers will have to measure this data, the legal limits may not be fully enforced until 2021.
That is not soon enough for some. Last month, London Mayor Sadiq Khan teamed up with the mayor of Paris, Anne Hidalgo, to launch an online vehicle checker.
Based on Emissions Analytics’ Air Quality index, the system is set to provide a rating of the vehicle’s performance and air quality based on real-life data.
The mayors have said the data will be used when making fleet buying decisions for public sector bodies, and encourage those in the Greater London Authority Group to ‘only buy or lease the cheapest vehicles’.
As the crackdown on poor air quality continues, it seems highly likely that these measures will gradually creep into procurement processes. An eye to the cleanest vehicles – both on paper and in real life – will become ever more important.
What are the differences in real-world economy?
Independent vehicle testing firm Emissions Analytics has been recording real-world economy for a cross-section of car and van models that are on sale in the UK and Europe today.
The tests are conducted using Portable Emissions Measurement (PEM) machinery, in a similar manner to those performed by PSA Group of its own vehicles.
Emissions Analytics’ research is manufacturer neutral, and tests are performed on a set route around its Oxfordshire base.
The company uses formulas and calculations to measure real-time emissions throughout the journey, and negate the differences inevitable with real traffic.
“When you’re testing on the road the thing you can’t control is traffic flow,” says Molden.
“You can keep the driver the same and the route the same. You can do it within certain ambient conditions and you can make sure the tyres are inflated to the right pressures. You can do a lot to standardise , but, ultimately, you can’t control the traffic flow.”
Around 1,500 models have now been tested, with data extrapolated across trim levels to create a database of around 60,000 vehicles, called the Equa Index.
Nearly all new cars (98%) fail to achieve their official fuel economy figures, according to the index.
Official and Equa ‘real world’ fuel economy figures can be compared online without charge using the Fleet News website tools, at www.fleetnews.co.uk/equa-mpg. We took a cross-section of fleet-friendly models, across a variety of sectors, to identify the range of economy variance in the market.
| Model | NEDC combined (mpg) | Equa combined (mpg) | Difference | ||
| City car | |||||
| Peugeot 108 1.0 VTi 68 Active | 68.9 | 51.2 | -25.70% | ||
| Hyundai i10 1.0 66 SE | 60.1 | 44.8 | -25.50% | ||
| Lower-medium car | |||||
| Ford Focus 1.0 Ecoboost 100 Zetec | 61.4 | 42 | -31.6 | ||
| Volkswagen Golf 1.0 TSI 115 BMT Match Edition | 62.8 | 46.5 | -25.90% | ||
| Mid-size SUV | |||||
| Nissan Qashqai 1.5 dCi 110 Acenta | 74.3 | 48.3 | -34.90% | ||
| Fiat 500X 1.6 Multijet 120 Pop Star | 68.9 | 49.9 | -27.60% | ||
| Premium car | |||||
| BMW 320d 163 EfficientDynamicsPlus | 74.3 | 48.2 | -35.10% | ||
| Jaguar XE SE 163 | 68.9 | 41.9 | -39.20% | ||
| Large SUV | |||||
| Audi Q5 2.0 TDI 190 Quattro SE | 56.5 | 36.5 | -35.40% | ||
| Volvo XC60 2.0 D4 SE Nav | 60.1 | 42.9 | -28.60% | ||


Login to comment
Comments
No comments have been made yet.