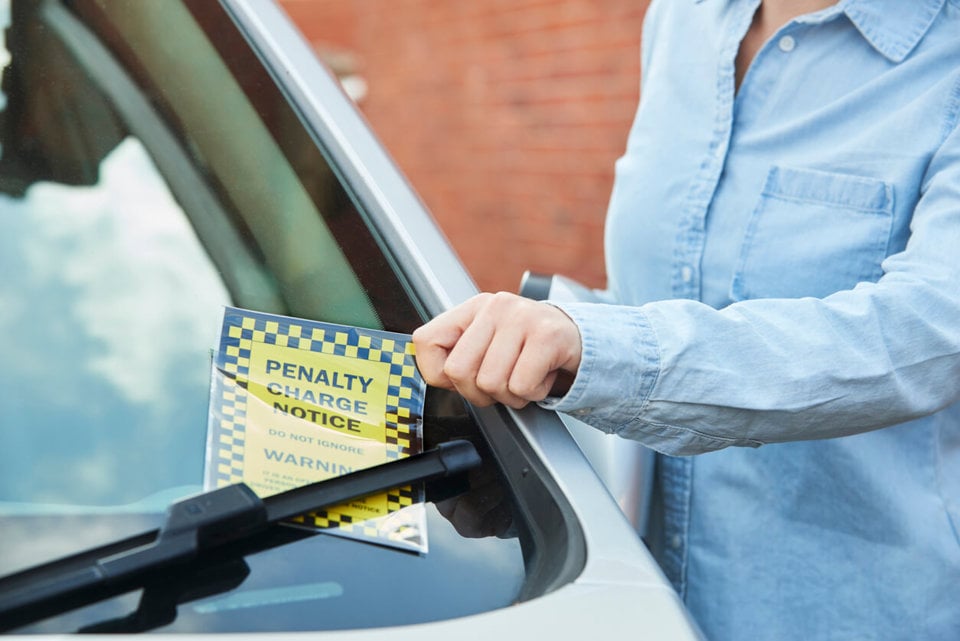
Councils in England have seen their parking ‘profits’ rise by almost a third (32%) in just four years.
In 2017-18, the combined surplus made by the 353 English local authorities was £867 million, up from £658m in 2013-14.
Total income from both on- and off-street parking activity was £1.66 billion in 2017-18.
Total expenditure was £793m. Additionally, councils may incur interest payments or depreciation on their capital assets such as car parks, though this is not accounted for in these official figures.
The difference between the two – £867m – is the surplus or profit.
This is 6% more than the £819m made in the previous financial year (2016-17). It is also 11% higher than the £782m surplus that the councils themselves had budgeted for.
Analysis by David Leibling for the RAC Foundation shows that of the 353 councils which made official financial returns to central government, only 39 made a loss from their parking activities.
|
£million |
2013-14 |
2014-15 |
2015-16 |
2016-17 |
2017-18 |
2017-18 budget |
2018-19 budget |
Change 2017-18 on 2016-17 |
|
|
On-street |
Fees and permits |
435 |
472 |
483 |
542 |
578 |
7% |
||
|
Penalties |
340 |
328 |
338 |
347 |
376 |
8% |
|||
|
Total income |
775 |
800 |
821 |
889 |
954 |
7% |
|||
|
Expenditure |
408 |
421 |
407 |
414 |
431 |
4% |
|||
|
Surplus |
367 |
379 |
414 |
475 |
523 |
10% |
|||
|
Off-street |
Total income |
640 |
645 |
670 |
693 |
706 |
2% |
||
|
Expenditure |
349 |
341 |
340 |
349 |
362 |
4% |
|||
|
Surplus |
291 |
304 |
330 |
344 |
344 |
– |
|||
|
All parking |
Total income |
1,415 |
1,445 |
1,491 |
1582 |
1660 |
5% |
||
|
Expenditure |
757 |
762 |
747 |
763 |
793 |
4% |
|||
|
|
Surplus |
658 |
683 |
744 |
819 |
867 |
782 |
885 |
6% |
|
|
|
|
|||||||
|
All England transport |
Expenditure |
4,796 |
4,537 |
4,331 |
4,012 |
3,997 |
4,240 |
4,251 |
-0.4% |
|
Parking surplus as % of net transport expenditure |
14% |
15% |
17% |
20% |
22% |
18% |
21% |
25 councils in England with the highest levels of surplus
|
£000 |
Parking operations Surplus |
||||||
|
Local authority |
Type of authority |
2013-14 |
2014-15 |
2015-16 |
2016-17 |
2017-18 |
Ranking by 2017-18 surplus |
|
Westminster |
L |
51,037 |
46,426 |
55,875 |
73,191 |
57,582 |
1 |
|
Kensington & Chelsea |
L |
33,512 |
32,997 |
34,237 |
32,174 |
34,467 |
2 |
|
Wandsworth |
L |
19,692 |
20,350 |
21,174 |
20,506 |
24,216 |
3 |
|
Hammersmith & Fulham |
L |
22,960 |
23,787 |
22,672 |
23,077 |
23,817 |
4 |
|
Brighton & Hove |
UA |
18,090 |
18,642 |
20,075 |
21,213 |
23,420 |
5 |
|
Islington |
L |
10,381 |
13,732 |
15,532 |
19,111 |
20,514 |
6 |
|
Camden |
L |
24,869 |
24,468 |
25,228 |
26,751 |
19,599 |
7 |
|
Newham |
L |
7,202 |
7,327 |
7,692 |
8,886 |
18,977 |
8 |
|
Haringey |
L |
5,700 |
16,145 |
14,917 |
14,635 |
16,841 |
9 |
|
Hackney |
L |
8,219 |
10,758 |
12,920 |
14,505 |
15,613 |
10 |
|
City of London |
L |
5,569 |
5,881 |
5,264 |
6,549 |
14,383 |
11 |
|
Merton |
L |
7,015 |
7,226 |
6,681 |
10,227 |
12,279 |
12 |
|
Hounslow |
L |
7,814 |
7,655 |
7,196 |
11,972 |
12,243 |
13 |
|
Lambeth |
L |
7,219 |
9,683 |
9,942 |
11,923 |
12,143 |
14 |
|
Brent |
L |
8,310 |
10,506 |
7,954 |
10,534 |
11,870 |
15 |
|
Milton Keynes |
UA |
8,160 |
9,042 |
10,757 |
11,143 |
11,296 |
16 |
|
Birmingham |
UA |
7,756 |
9,699 |
9,816 |
11,129 |
11,183 |
17 |
|
Barnet |
L |
7,879 |
346 |
6,703 |
8,643 |
10,690 |
18 |
|
Tower Hamlets |
L |
8,318 |
10,038 |
9,479 |
9,504 |
10,591 |
19 |
|
Richmond upon Thames |
L |
7,040 |
6,328 |
7,462 |
8,262 |
9,815 |
20 |
|
Cornwall |
UA |
8,019 |
8,693 |
9,813 |
9,742 |
9,744 |
21 |
|
Bristol |
UA |
7,495 |
6,053 |
7,696 |
9,537 |
9,503 |
22 |
|
Manchester |
UA |
8,020 |
7,915 |
8,919 |
7,751 |
9,368 |
23 |
|
Newcastle upon Tyne |
UA |
6,296 |
6,643 |
7,269 |
7,465 |
8,541 |
24 |
|
Leeds |
UA |
6,894 |
7,213 |
6,635 |
7,793 |
8,425 |
25 |
Steve Gooding, director of the RAC Foundation, said: “When totted up council parking income amounts to a multi-million-pound business.
“Our purpose in publishing this analysis is not to suggest the existence of any sharp practice, but to encourage motorists to seek out and read their own local authority’s annual parking report – and ask some pointed questions if their authority doesn’t publish one.
“We think it is important that motorists check for themselves whether their own council’s explanation of the level of charges, penalties and details of how the net income is then spent reflects, as it should, the use of parking controls purely as a tool to manage traffic.”
Find the full table of all English local authorities in A-Z order click here.


Login to comment
Comments
No comments have been made yet.