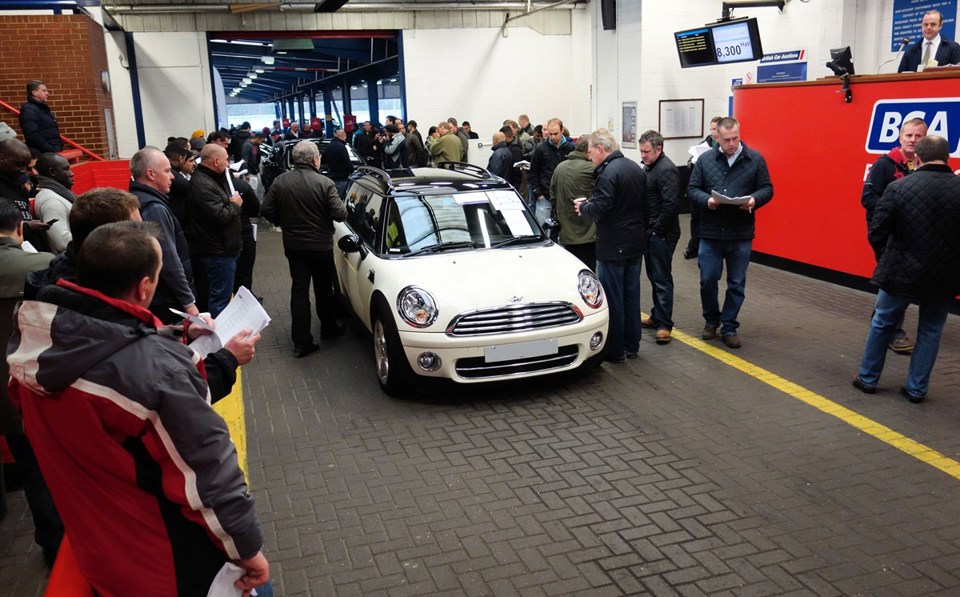
Experian, the global information services company, has published its latest Used Car Sales Index, revealing the lowest first quarter sales figures since 2005.
A total of 1,653,668 used cars were sold from January to March this year, which represents a 5% decrease compared to the same quarter in 2012, when used car sales hit the highest Q1 since 2009.
Despite challenging conditions, both electric and hybrid models continued to show significant increases in sales with a 13.6% and a 13.1% uplift on Q1 2012, respectively.
The only segment to enjoy an uplift in sales compared to Q1 2012, was the 4x4 (such as Range Rover Vogue and BMW X5) – up 7.4%.
The Specialist Sports category (including the Audi TT and the Mazda MX5) saw the most significant fall – down 10.4% on Q1 of last year.
The Upper Medium segment was the second hardest hit (which includes the Ford Mondeo and the BMW3 series) with a 10.1% drop in sales on Q1 2012.
Across the UK, all areas experienced a decrease in used car sales in the first quarter of 2013, with sales in Greater London falling by 7.9% and sales in Scotland experiencing the second highest fall at 6.7%, compared to Q1 2012.
The Ford Focus kept its crown as best-selling used car of the quarter selling over 77,000 units from January to March.
The Volkswagen Polo retained its position in the top ten narrowly overtaking sales of the Ford KA, which kept it out of the top ranked used cars in Q2 and Q3 last year.
In addition, Volkswagen and Nissan were the only two to see an increase in used car sales - up by 1.2% and 1% respectively.
Andrew Ballard, principle consultant at Experian Automotive, said: “Our figures show that some categories are consistently performing well even in a challenging environment.
“Electric and hybrid vehicles, and also the 4x4 segment, have shown strong growth in used car sales indicating that reliable mobility in harsher weather conditions plus environmental and cost saving factors are front of mind.
“These trends are important indicators for dealerships when identifying and building the optimum, profitable stock mix.”
|
Segment |
Q1 2013
|
% change from Q1 2012 |
Q1 2012 |
|
4x4 |
115724 |
7.46 |
107689 |
|
Executive |
74050 |
-7.61 |
80153 |
|
Lower Medium |
455050 |
-4.98 |
478890 |
|
Luxury |
9681 |
-8.54 |
10585 |
|
MPV |
94710 |
-8.42 |
103415 |
|
Mini |
27916 |
-8.83 |
30620 |
|
Specialist Sports |
54769 |
-10.44 |
61153 |
|
Supermini |
541133 |
-2.75 |
556408
|
|
Upper Medium |
260613 |
-10.17 |
290124 |
|
Total |
1653668 |
-5.06 |
1741860 |
Source: Experian’s MarketView Online and the DVLA
|
Make |
Q1 2013 Rank
|
Total units sold Q1 2013 |
Q1 2012 Rank |
|
FORD FOCUS |
1 |
77186 |
1 |
|
FORD FIESTA |
2 |
76165 |
3 |
|
VAUXHALL CORSA |
3 |
73515 |
2 |
|
VAUXHALL ASTRA |
4 |
66387 |
4 |
|
VOLKSWAGEN GOLF |
5 |
53841 |
5 |
|
BMW 3 SERIES |
6 |
46390 |
6 |
|
RENAULT CLIO |
7 |
42746 |
7 |
|
PEUGEOT 206 |
8 |
34151 |
9 |
|
FORD MONDEO |
9 |
32977 |
8 |
|
VOLKSWAGEN POLO |
10 |
30868 |
10 |
Source: Experian’s MarketView Online and the DVLA
|
|
Q1 2013
|
% change from Q1 2013 |
Q1 2012 |
|
DIESEL |
554482 |
4.57 |
530233 |
|
ELECTRIC |
930 |
13.69 |
818 |
|
PETROL |
1088690 |
-9.41 |
1201741 |
|
PETROL/ELECTRIC |
6342 |
13.19 |
5603 |
|
~Others |
3224 |
-6.96 |
3465 |
|
Total |
1653668 |
-5.06 |
1741860 |
Source: Experian’s MarketView Online and the DVLA
|
Region |
Q1 2013
|
% change from Q1 2012 |
Q1 2012 |
|
East Anglia |
77465 |
-3.71 |
80448 |
|
East Midlands |
138766 |
-4.79 |
145741 |
|
Greater London |
144180 |
-7.97 |
156664 |
|
North |
81059 |
-5.43 |
85711 |
|
North West |
161558 |
-4.99 |
170040 |
|
Scotland |
139956 |
-6.75 |
150080 |
|
South East |
351180 |
-3.27 |
363051 |
|
South West |
168410 |
-3.22 |
174019 |
|
Wales |
90818 |
-6.22 |
96838 |
|
West Midlands |
160322 |
-5.65 |
169922 |
|
Yorkshire And The Humber |
139936 |
-6.29 |
149324 |
|
Total |
1653668 |
-5.06 |
1741860 |
Source: Experian’s MarketView Online and the DVLA


Login to comment
Comments
No comments have been made yet.